FleetBridge
UX CASE STUDY
Fleetbridge is a fleet management software designed to manage, analyze, and improve fleet operations. Despite its robust feature set, user feedback highlighted challenges in usability, navigation, and data interpretation. Our goal was to enhance Fleetbridge’s UX to improve efficiency, reduce cognitive load, and streamline fleet operations.
The product leadership’s main goal was to enhance the current legacy fleet application into a modern and more user-friendly application. This process involves recreating the application from scratch, using the knowledge and customer experience gained from the legacy version into a more robust application for the users.
Fleet managers and operators found the interface overwhelming due to excessive data presentation, unclear workflows, and limited mobile optimization. They needed a more intuitive system to track vehicle health, manage fuel efficiency, and receive real-time alerts without being overwhelmed.
To create a more intuitive, user-friendly experience that allows fleet managers to efficiently monitor vehicle health, optimize fuel consumption, and receive actionable insights with minimal effort.

We have followed different steps of the Design Thinking process to provide a solution-based approach to solving problems. Understand,
research, analysis, design and test & iterate.
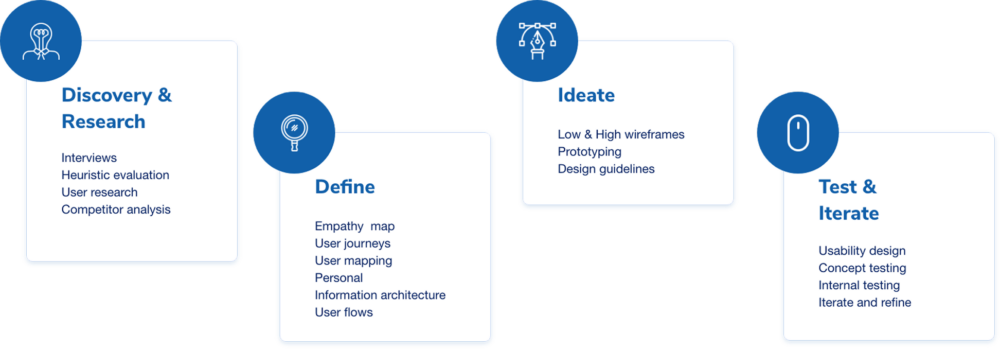

I conducted extensive user research on the current legacy systems, understanding user behaviour on how it’s been used, and conducted interviews with selected customers on what features are most valuable to them and can be improved. This research was compiled into proper documentation and presented to stakeholders for feedback. Research highlights below:
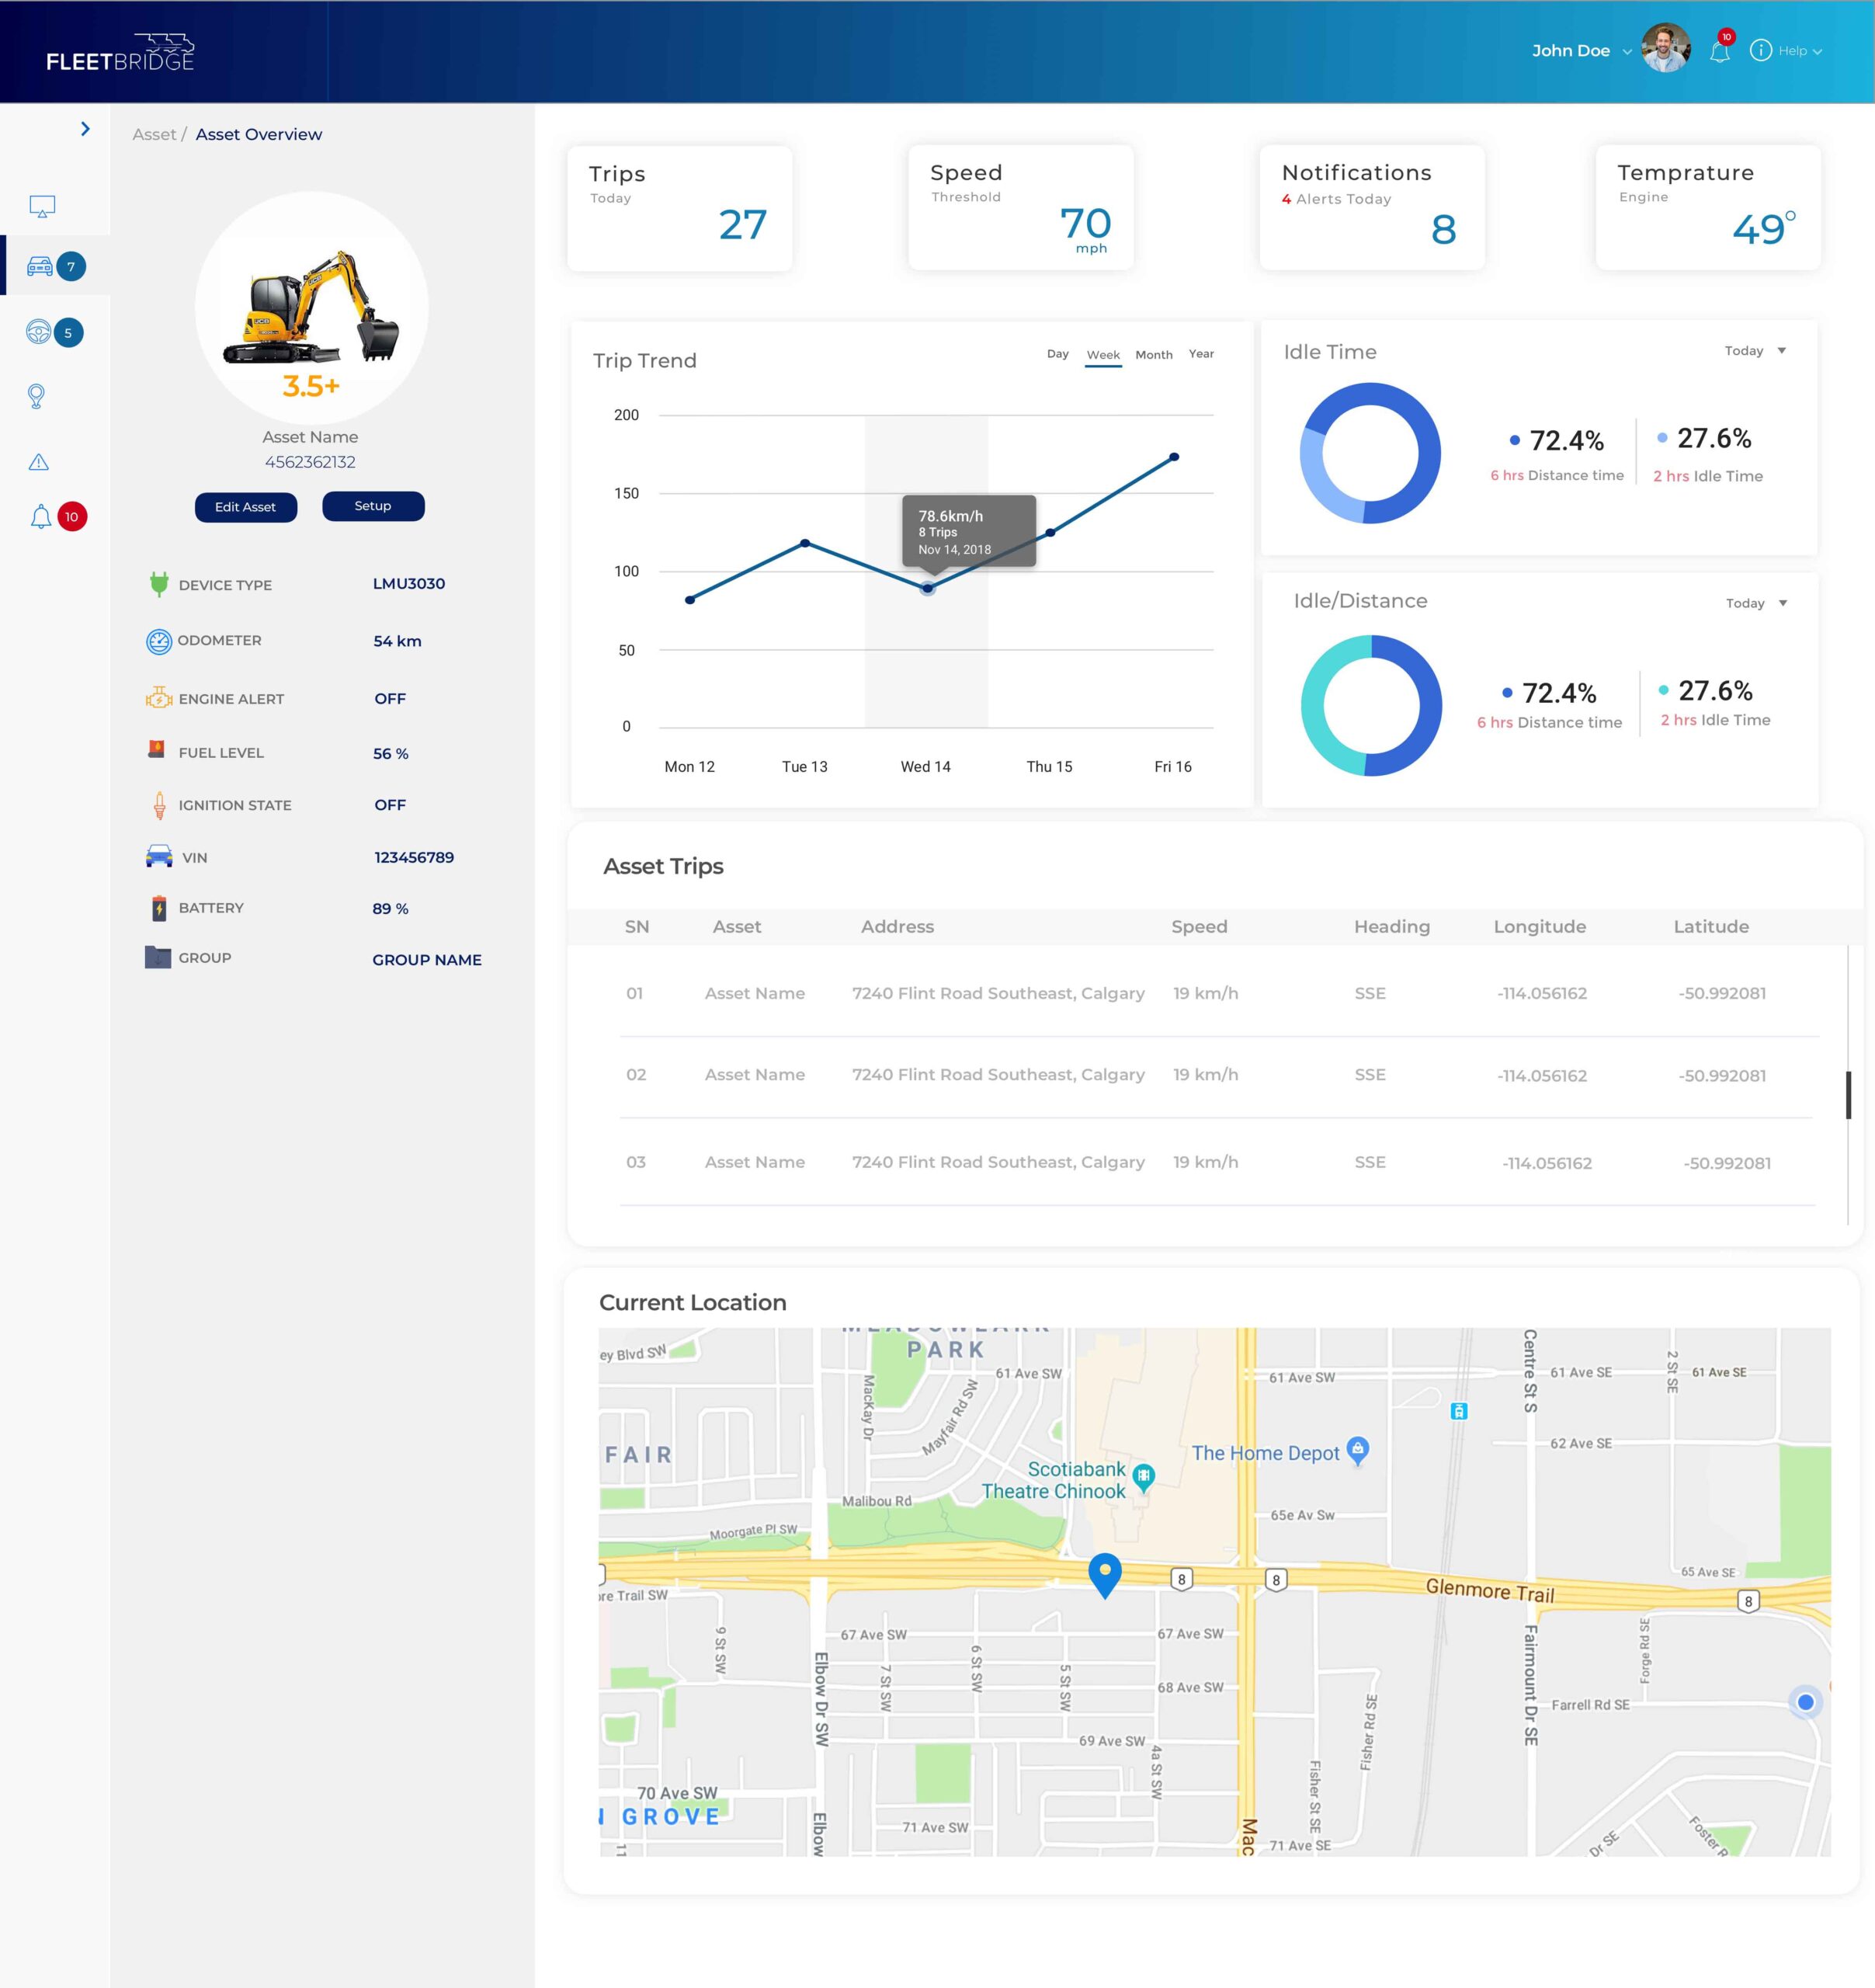
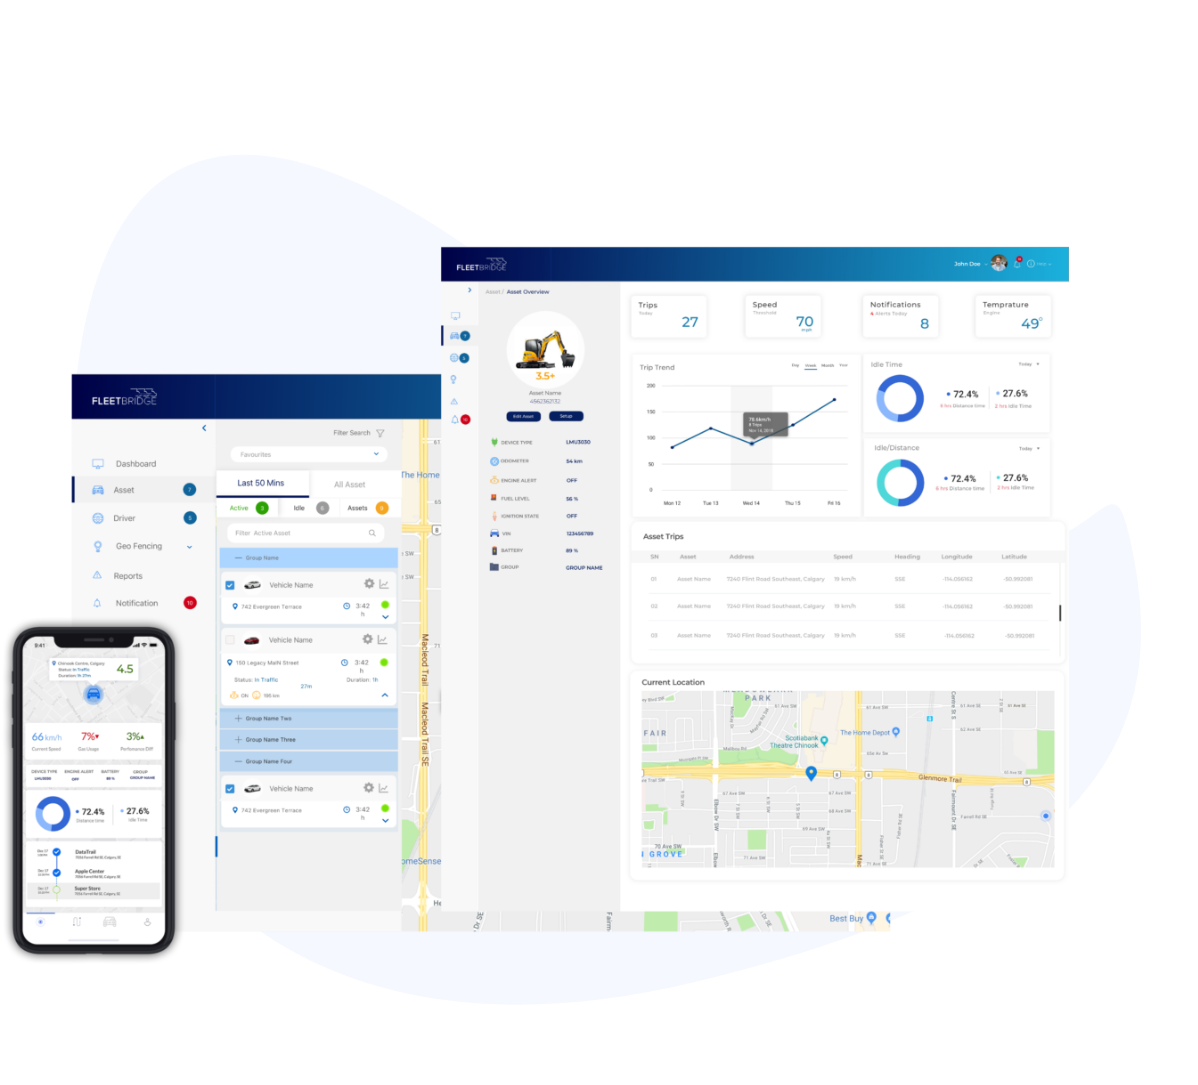
Dashboard Redesign:
- Introduced a modular dashboard with customizable widgets.
- Prioritized key metrics such as fuel usage, vehicle health, and trip performance.
- Implemented a clean, visually appealing interface with better data visualization.
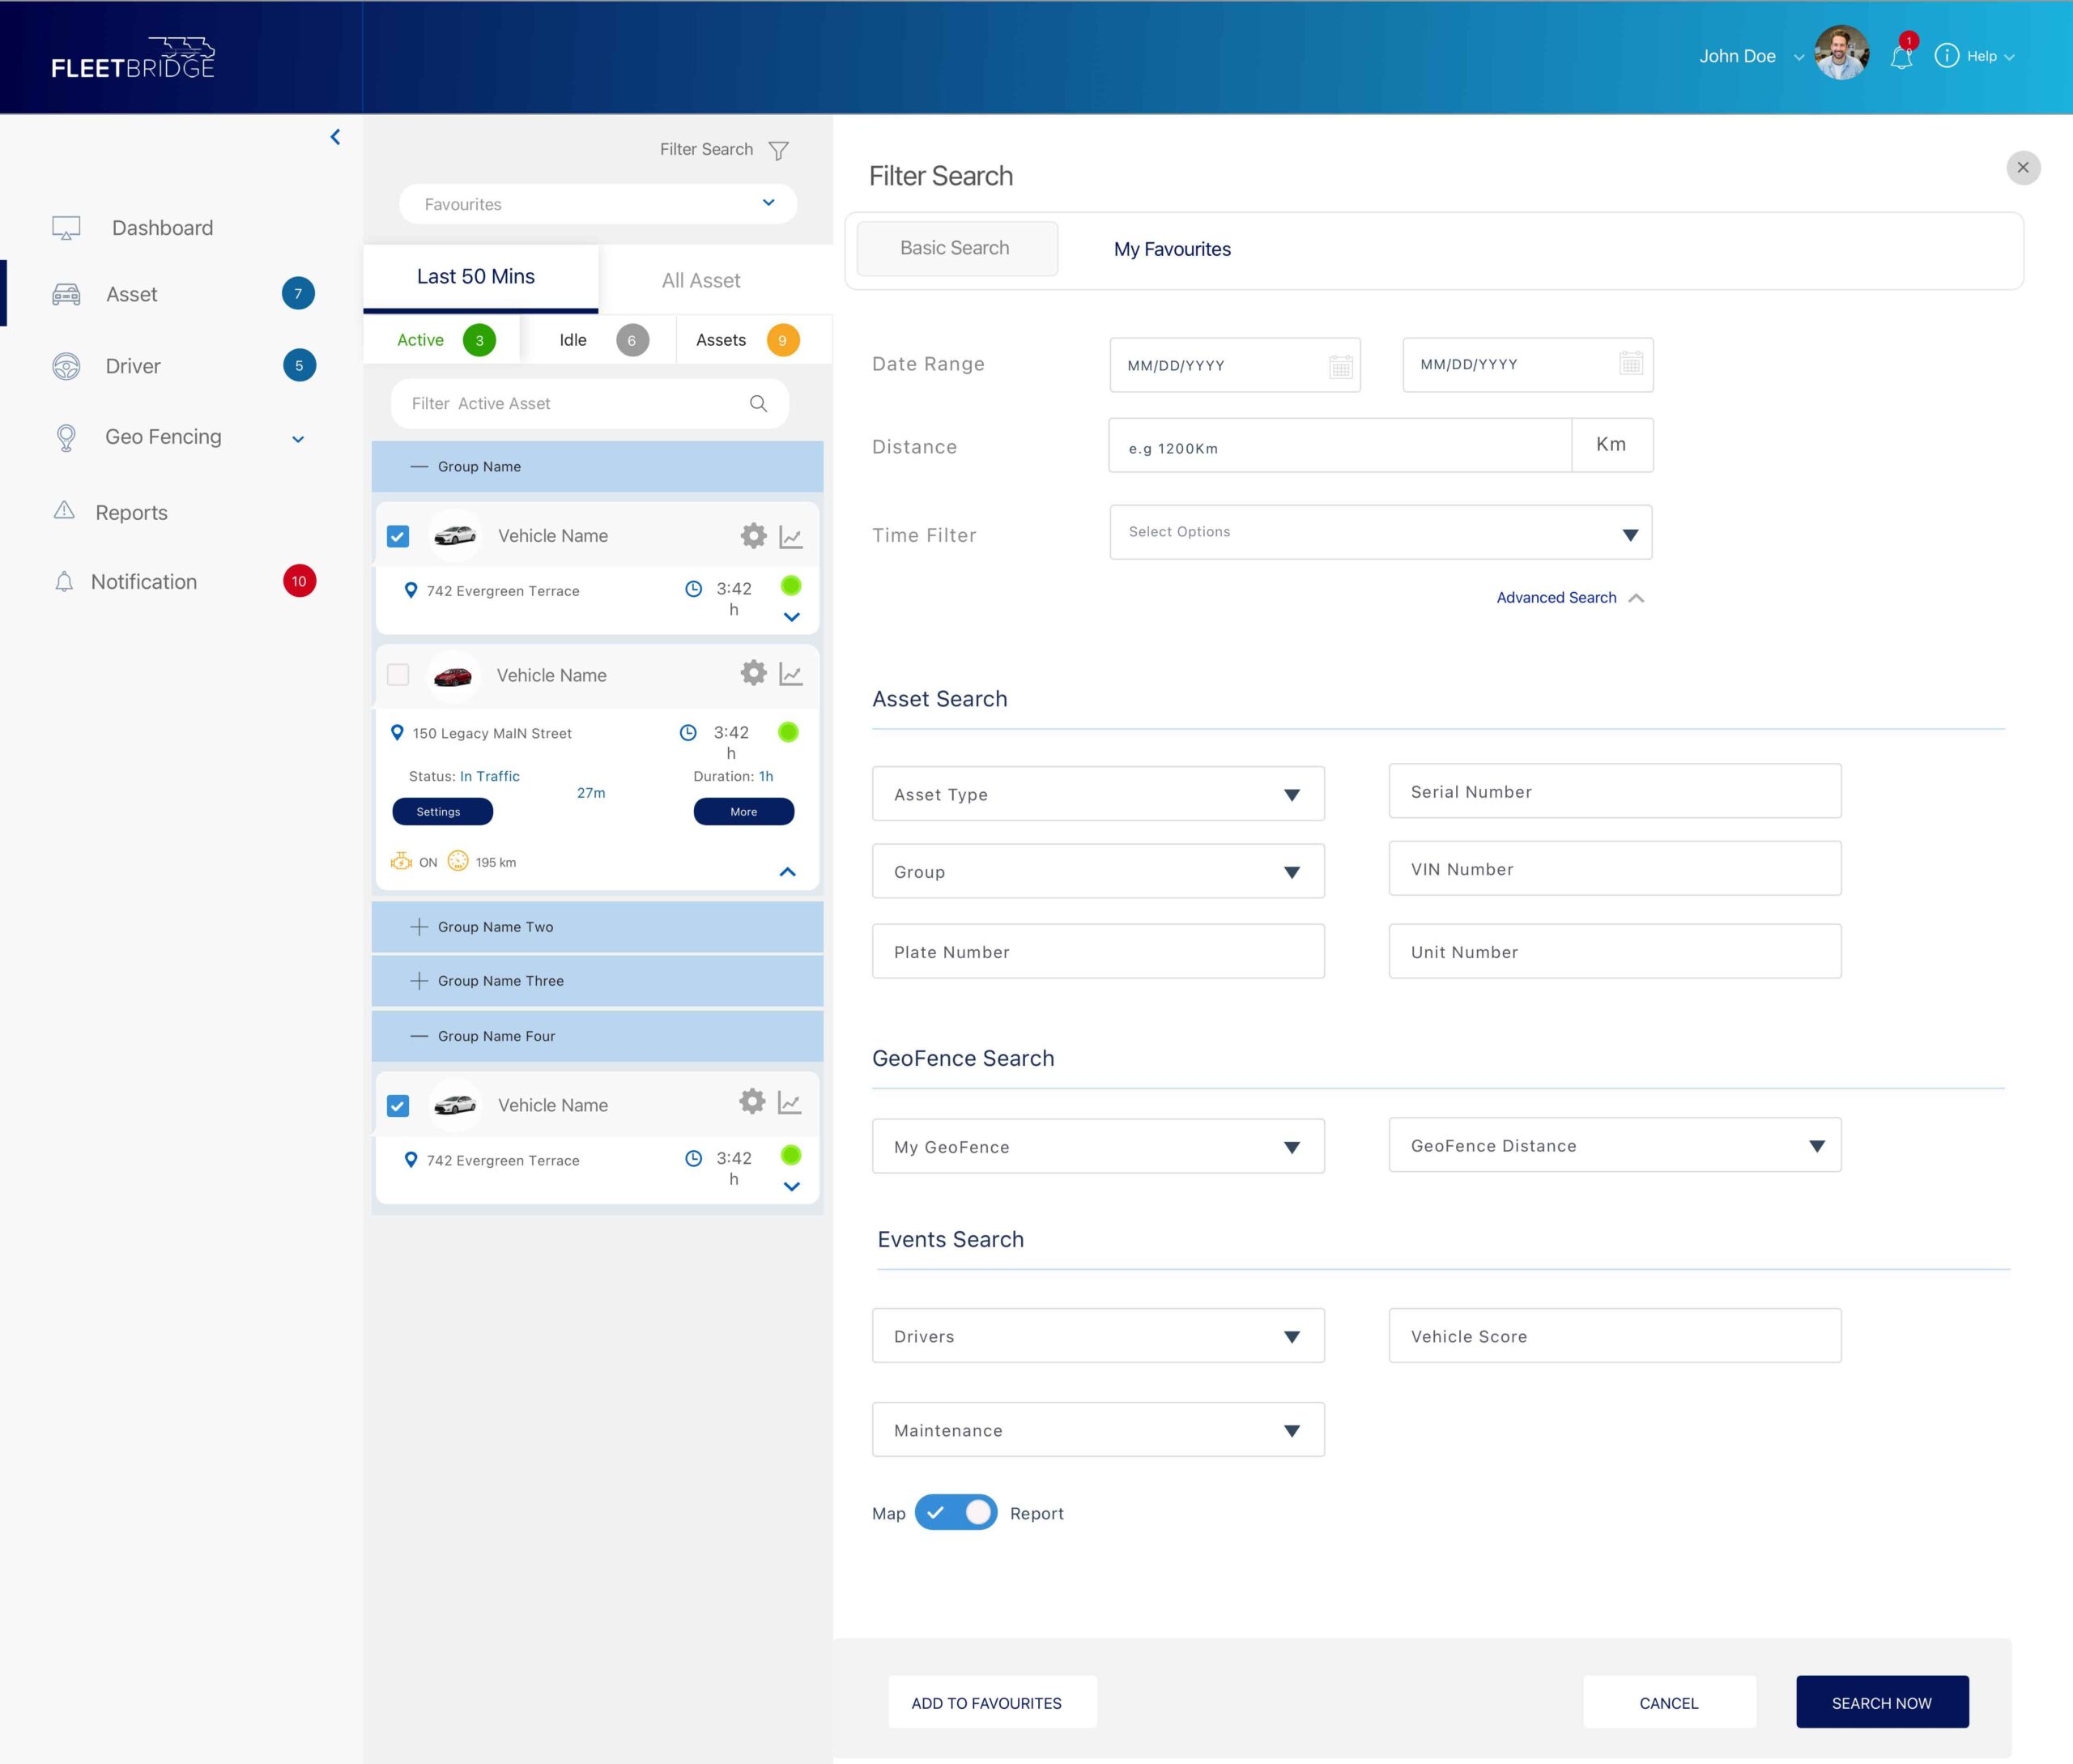
Navigation Enhancement:
- Simplified the menu structure for intuitive navigation.
- Grouped related features to reduce cognitive load.
- Implemented a global search function for quick access to vehicles, drivers, and reports.
Improved Reporting & Data Insights:
- Created an easy-to-use report builder with pre-set templates.
- Integrated interactive charts for better data interpretation.
- Enabled automatic report scheduling and exports.
Mobile Optimization:
- Developed a responsive mobile interface for quick access on-the-go.
- Implemented push notifications for critical alerts.
- Simplified workflows for mobile users, reducing steps for key tasks.
Results & Impact:
- User Satisfaction: Post-implementation surveys showed a 40% increase in user satisfaction.
- Efficiency Gains: Task completion time for report generation reduced by 55%.
- Adoption Rate: Mobile app engagement increased by 68%.
- Error Reduction: Reduced fleet tracking errors by 30% due to better UI clarity.
Conclusion:
The UX improvements in Fleetbridge transformed it into a more user-friendly, efficient, and intuitive platform. By prioritizing user needs, we enhanced fleet managers’ ability to monitor operations, respond to alerts, and optimize vehicle performance effectively.